Top bowling pairs at work: a fresh look
A detailed analysis of various performance aspects of the top bowling pairs in Tests
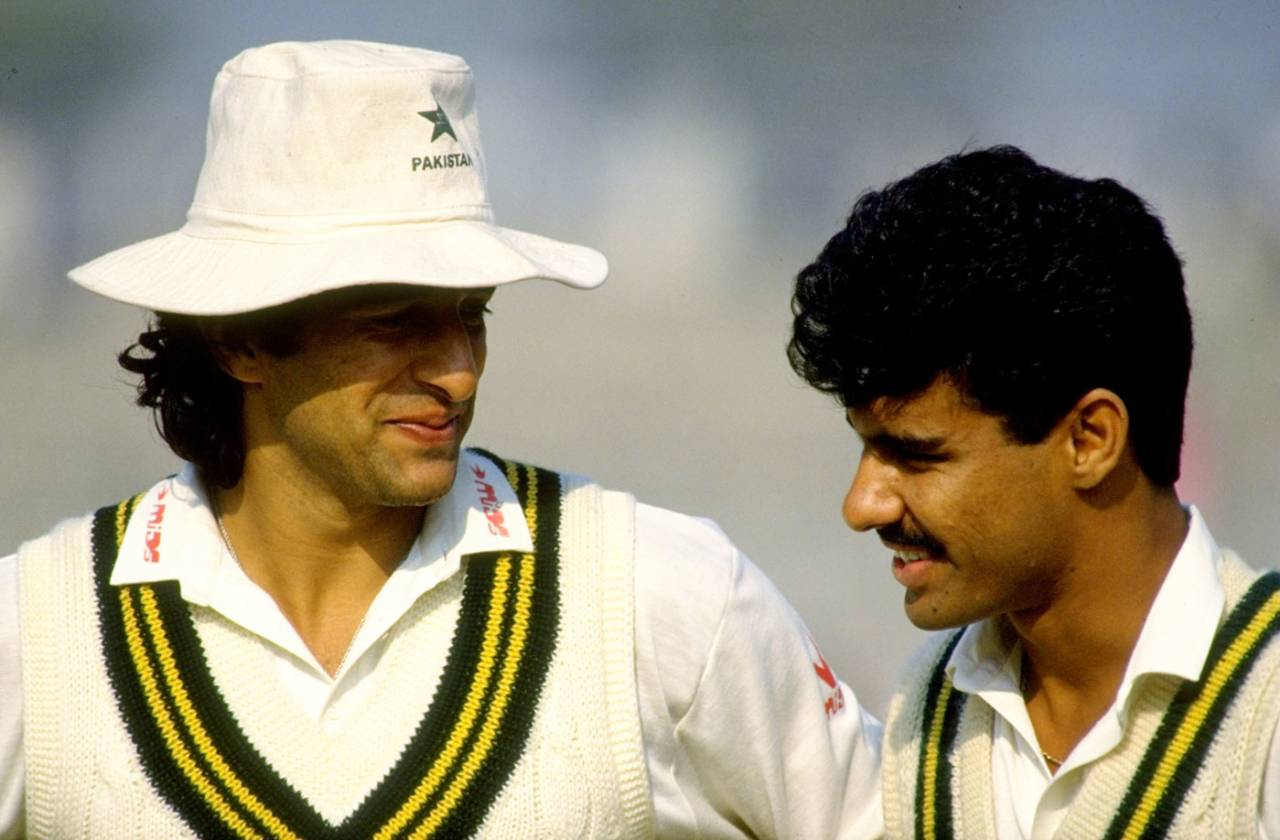
Wasim Akram and Waqar Younis captured 15 or more wickets in a match on ten occasions • Getty Images
A few years back I had taken an across-the-years look at the Test bowling pairs. I had analysed all the pairs and came out with a series of tables. That article merely set the stage. I have taken the next significant step in this article. Using that type of analysis as the base, I have selected 10 top bowling pairs and analysed these individually and as a pair. I am confident that the selected pairs would include most of the top bowlers though there may be other top bowlers who operated alone or in combination with these pairs. This has been a very difficult article for me to compile and it would be equally difficult for the readers to go through and grasp all details. Hence I request the readers to kindly take time. Do not rush.
Warne & McGrath            1001 wkts
Muralitharan & Vaas         895
Walsh & Ambrose             762
Wasim Akram & Waqar Younis  559
Willis & Botham             476
Donald & Pollock            397
Chandrasekhar & Bedi        368
Hadlee & B Cairns           337.
I have used my discretion only in two cases: South Africa and India. Pollock and Kallis have captured more wickets than Donald & Pollock. However I felt that I needed a real top quality bowling pair and have opted for the latter combination. Pollock & Ntini was another possibility. But I have gone with my heart in this selection as well as that of the Indian pair.
As far as India is concerned, I have not plumped for Kumble & Harbhajan against Chandrasekhar and Bedi even though the former pair has captured well over 100 wickets more. This is both nostalgia and a recognition, that these bowlers turned India into a force for the first time, albeit only at home. I am sure no reader would have any serious objections to the selection of this wonderful duo. My apologies to Kumble & Harbhajan.
Now for the two remaining pairs.
I decided that I would select an additional pair each from the two most successful bowling countries in history, viz., West Indies and Australia. For West Indies, I wanted a pair from the eighties even though Sobers & Gibbs are second, in terms of wickets. Ignoring repeats, the next best was Holding & Garner. But I bit the bullet and went for Garner & Marshall since I cannot think of any bowler analysis without Marshall. Anyhow Garner & Marshall have captured 322 wickets between them as against Holding & Garner, with 331.
Australia presented a few problems. Combinations involving Warne or McGrath were ruled out automatically. That presented me with two pairs: Benaud & Davidson with 346 and Miller & Lindwall with 345. It was an easy decision to select Miller & Lindwall, the pair from late-40s. That completes the top-10 bowling pairs.
Lillee, Thomson, Grimmett, O'Reilly et al did not meet the 100-wkts criterion. There was a case for Kumble & Harbhajan or Prasanna & Bedi or Pollock & Ntini, but the reasons have already been given. Imran & Qadir had 332 wickets but were way behind the great W-pair. Holding and Davidson just missed out.
I have considered each pair separately and presented a huge collection of data elements. It is going to be impossible to comment on all. I will only make comments on the special characteristics of each pair. The readers should download the huge table and do their own sub-analysis. I am sure there would be a comment or two that all these are available in Cricinfo and there is nothing new. That is fine.
Whoever made the debut earlier is named as the first bowler in each pair. All Tests between that debut and the retirement Test of latter constitute the overall range for various analyses. For the pair level analyses the range is strictly between the first and last Tests the pair operated together and only those in which they played together. Each pair has one graph and an exhaustive table. I have also distributed the comments across the pairs.
I have introduced two new concepts here. It is better that I explain these two now before moving on to the Pair details. Like the Form-Dip in the Lara article, these are the starting points and can be refined as we go on. Comments on these two will be very valuable to will fine-tune the ideas.
The first one is an analysis of the Pair-successes. I have considered only those innings in which the team captured 5 or more wickets. I consider that the pair has succeeded if they capture 50% or more of the team wickets. Examples are 3+ out of 5 & 6, 4+ out of 7 & 8 and 5+ out of 9 & 10. The idea is that since these were the premier pairs in their respective teams, they are expected to contribute at least 50% of the team wickets. Fairly subjective I agree, but there are some interesting results. The bar is set quite high but that is the way it should be.
The second is how the individuals performed within these pairs. For this analysis, I have considered only those innings in which the pair captured 5 or more wickets. The dominant bowler within the pair is identified as the one who leads 4-1 (and obviously 5-0) when 5 wickets are captured by the pair. Similarly, in case of 6 wickets captured by the pair, the dominant bowler is the one with 4-2 split (and the wider gaps).
This can be extended to 5-2 (and wider) for 7, 6-2 (and wider) for 8, 6-3 (and wider) for 9 and 7-3 (and wider) for 10 wickets. Again early days. But the idea is worth exploring.
The % of top-order wickets (1 to 6) is very close for all pairs and oscillates on either side of 60%. It is amazing that the % of top order wickets (1-6) is around 60% which is 6/10. I expected this figure to be around the 65% mark. Let me finish this discussion here itself. Only two pairs have this % figure around 66%: Donald & Pollock and Miller & Lindwall. However the big surprise is that Wasim Akram and Waqar Younis have a figure of 57.2%, the lowest amongst these pairs. Seems quite intriguing.
Similarly I will complete the discussion on the team against which the pairs captured their highest number of wickets at this point. Barring two pairs, the other eight pairs have captured their highest number of Tests against England, indicating the frequency of Tests played against England. Warne & McGrath lead with 267 wickets against England. The two other pairs are Akram and Younis, who reserved their best against West Indies and Willis & Botham, who, for some strange reason I cannot comprehend, failed to capture a single wicket against England, reserving their best for Australia.
The graphs, 10 in all, cannot be too big and show all information. Hence I have concentrated on showing relative average values and wins, especially away from home.
Warne & McGrath
P01. Warne 513 @ 24.88 & McGrath 488 @ 21.38 Total: 1001 @ 23.17
-------------------------------------------------------------------
Warne       : 1181(1992)-1826(2007) 513 @ 24.88 (195 @ 26.83) 92.7%
McGrath     : 1235(1993)-1826(2007) 488 @ 21.38 ( 75 @ 23.35) 91.6%
Pair Career:  1235(1993) to 1826(2007)
All matches:          177      Wins: 111 (62.7 %)
Pair matches:         104      Wins:  71 (68.3 %)
Pair Home matches:     54      Wins:  43 (79.6 %)
Pair Away matches:     50      Wins:  28 (56.0 %)
Non-Pair matches:      73      Wins:  40 (54.8 %)
Non-Pair Home matches: 43      Wins:  25 (58.1 %)
Non-Pair Away matches: 30      Wins:  15 (50.0 %)
Matches on their own  Warne: 41  McGrath: 20
Pair   Home wkts:  504 @ 24.40  Away wkts:  497 @ 21.93
Others Home wkts:  472 @ 27.24  Away wkts:  340 @ 32.29
Team Wkts:        1813 @ 25.94  WpT: 9.62  Pair %: 55.2
TeamPeerWkts:      812 @ 29.35
AllPeerWkts:     14765 @ 31.22
Top Order Wkts:    597 (59.6%)  Low Order Wkts:  221 (22.1%)
Top Order Home Wkts: 308 (61.1%)  Top Order Away Wkts: 289 (58.1%)
Highest vs England:  263 @ 21.97
Team wkts-5+: 183  Pair-Successes (50% of Team or more): 118 (64.5%)
Pair wkts-5+: 118 Shared: 74 Warne-dominant: 23 McGrath-dominant: 21
Most figures are self-explanatory. Let me explain Warne's "513 @ 24.88 (195 @ 26.83) 92.7%" further. Warne captured 513 wickets at 24.88 when playing with McGrath and 195 wkts @ 26.83 without him. 92.7%, i.e. a figure below 100%, indicates that Warne's average improves when he plays with McGrath.
The pair-successes % stands at 64. A perusal of the remaining pairs shows that there are other pairs with better figures. That is understandable since those pairs might have constituted over 75% of the bowling strength of their respective teams, which is not true of Warne & McGrath. They also seem to have been fairly similar in the bowler-dominance numbers.
As expected this pair has highs in the overall win % and wickets per Test. Both of them have performed similarly, at just over 90%, when operating individually, indicating the good support available elsewhere. It is also surprising, but not unexpected, that the pair has performed better away than at home. They have also out-performed their own team-mates by well over 50%, away from Australia.
It is indeed very surprising that in their illustrious career Warne & McGrath have never captured all 10 wickets in an innings. Their best innings performance has been Test # 1590 against South Africa at Wanderers during 2002 when they captured 9 for 65 (4 for 44 & 5 for 21). Their best match performance has been 18 wickets (11 and 7) in Test # 1558 against England at Oval during 2001.
Conundrum of Test # 1313. I know there is a story behind it. There are a few instances of Miller not bowling a single ball in a Test when playing with Lindwall and that is understandable. But how does one explain the Hobart Test against Pakistan during 1995. In a match in which Australia bowled 150 overs, Warne did not bowl a single ball. Mark Waugh bowled 20 overs. Is it possible that Warne was injured since he did not bat in the second innings?
 Summary of bowling career of Shane Warne and Glenn McGrath
© Anantha Narayanan
Muralitharan & Vaas
P02. Muralitharan 586 @ 22.05 & Vaas 309 @ 28.01 Total: 895 @ 24.11
-------------------------------------------------------------------
Muralitharan: 1195(1992)-1964(2010) 586 @ 22.05 (209 @ 24.40) 90.4%
Vaas        : 1267(1994)-1927(2009) 309 @ 28.01 ( 46 @ 40.11) 69.8%
Pair Career:  1270(1994) to 1909(2009)
All matches:          155      Wins:  59 (38.1 %)
Pair matches:          94      Wins:  41 (43.6 %)
Pair Home matches:     50      Wins:  27 (54.0 %)
Pair Away matches:     44      Wins:  14 (31.8 %)
Non-Pair matches:      59      Wins:  18 (30.5 %)
Non-Pair Home matches: 25      Wins:   5 (20.0 %)
Non-Pair Away matches: 34      Wins:  13 (38.2 %)
Matches on their own  Muralitharan: 36  Vaas: 16
Pair   Home wkts:  534 @ 20.97  Away wkts:  361 @ 28.76
Others Home wkts:  317 @ 35.86  Away wkts:  226 @ 44.92
Team Wkts:        1438 @ 29.97  WpT: 9.52  Pair %: 62.2
TeamPeerWkts:      543 @ 39.63
AllPeerWkts:     16239 @ 31.40
Top Order Wkts:    544 (60.8%)  Low Order Wkts:  187 (20.9%)
Top Order Home Wkts: 310 (58.1%)  Top Order Away Wkts: 234 (64.8%)
Highest vs England:  139 @ 23.22
Team wkts-5+: 145  Pair-Successes (50% of Team or more): 115 (79.3%)
Pair wkts-5+: 116 Shared: 69 Muralitharan-dominant: 40 Vaas-dominant: 7
As expected, this is a pair with wide differences, especially in bowling averages. Muralitharan has dominated their successful innings in a big manner: 40-7. But as a pair they have succeeded a huge 79% of the times, the highest in this analysis.
Readers can see how much they have out-performed their own team bowlers in almost every measure. The bowling averages show a 60% difference. The win % drops substantially. As a pair, they captured 62% of the team wickets: the highest in this analysis. But here the story also is also about how dependent was Vaas on Muralitharan. With Murali, he averaged 28 and without Murali the average went up to 40. Murali himself seems to have gone his own merry way, with or without Vaas, with averages of 22 and 24.
Murali & Vaas have captured all 10 wickets in the innings no fewer than 4 times. Their best innings performance has been Test # 1755 against West Indies at SSC during 2005 when they captured 10 for 51 (6 for 36 & 4 for 15). Their best match performance has been 17 wickets (11 and 6) in Test # 1567 against West Indies at Gale during 2001. They also captured 17 wickets (3 and 14) in Test # 1572 against West Indies at SSC during 2001. Both Tests were played during the series with the unlikely combination of 3-0 and 688 losing runs. The series is also a special one in a way: almost the only series in which Vaas out-performed Muralitharan.
 Summary of bowling career of Muttiah Muralitharan and Chaminda Vaas
© Anantha Narayanan
Walsh & Ambrose
P03. Walsh 373 @ 24.29 & Ambrose 389 @ 21.12 Total: 762 @ 22.67
-------------------------------------------------------------------
Walsh       : 0997(1984)-1544(2001) 373 @ 24.29 (146 @ 24.82) 97.9%
Ambrose     : 1095(1988)-1509(2000) 389 @ 21.12 ( 16 @ 17.88) 118.1%
Pair Career:  1095(1988) to 1509(2000)
All matches:          142      Wins:  59 (41.5 %)
Pair matches:          95      Wins:  42 (44.2 %)
Pair Home matches:     50      Wins:  24 (48.0 %)
Pair Away matches:     45      Wins:  18 (40.0 %)
Non-Pair matches:      47      Wins:  17 (36.2 %)
Non-Pair Home matches:  8      Wins:   3 (37.5 %)
Non-Pair Away matches: 39      Wins:  14 (35.9 %)
Matches on their own  Walsh: 37  Ambrose: 3
Pair   Home wkts:  379 @ 23.06  Away wkts:  383 @ 22.29
Others Home wkts:  400 @ 31.41  Away wkts:  329 @ 32.53
Team Wkts:        1491 @ 27.19  WpT: 8.02  Pair %: 51.1
TeamPeerWkts:      729 @ 31.91
AllPeerWkts:     10257 @ 30.32
Highest vs England:  287 @ 21.92
Top Order Wkts:    474 (62.2%)  Low Order Wkts:  153 (20.1%)
Top Order Home Wkts: 233 (61.5%)  Top Order Away Wkts: 241 (62.9%)
Team wkts-5+: 147  Pair-Successes (50% of Team or more): 87 (59.2%)
Pair wkts-5+: 90 Shared: 56 Walsh-dominant: 14 Ambrose-dominant: 20
This is not necessarily the most successful West Indian pair. However they did capture over 750 wickets.
Ambrose has dominated the pair slightly, as shown by the 20-14 division in the dominance analysis. They have also succeeded nearly 60% of the times, indicating a lack of great bowling support.
That they bowled during the waning period for West Indies is shown by the win % values, which are all in the 40+ region. However as a pair they averaged 22.67 which is the third best in this analysis. Ambrose picked almost all wickets, barring 17, while bowling with Walsh. Their WpT is a not-too-great 8 and they have captured around half the team wickets.
Walsh & Ambrose have captured all 10 wickets in the innings once. This was in Test # 1188 against South Africa at Bridgetown at Wanderer's during 1992 when they captured for 10 for 65 (6 for 31 & 6 for 34). Their best match performance has been 16 wickets (5 & 11) in Test # 1257 against England at POS during 1994.
 Summary of bowling career of Courtney Walsh and Curtly Ambrose
© Anantha Narayanan
Akram & Younis
P04. Akram 282 @ 21.33 & Younis 277 @ 22.93 Total: 559 @ 22.12
-------------------------------------------------------------------
Akram       : 1010(1985)-1584(2002) 282 @ 21.33 (132 @ 28.51) 74.8%
Younis      : 1127(1989)-1637(2003) 277 @ 22.93 ( 96 @ 25.39) 90.3%
Pair Career:  1127(1989) to 1584(2002)
All matches:          143      Wins:  54 (37.8 %)
Pair matches:          60      Wins:  28 (46.7 %)
Pair Home matches:     22      Wins:  10 (45.5 %)
Pair Away matches:     38      Wins:  18 (47.4 %)
Non-Pair matches:      82      Wins:  26 (31.7 %)
Non-Pair Home matches: 22      Wins:   7 (31.8 %)
Non-Pair Away matches: 60      Wins:  19 (31.7 %)
Matches on their own  Akram: 43  Younis: 26
Pair   Home wkts:  223 @ 20.27  Away wkts:  336 @ 23.35
Others Home wkts:  142 @ 32.46  Away wkts:  272 @ 32.68
Team Wkts:         973 @ 26.58  WpT: 9.32  Pair %: 57.5
TeamPeerWkts:      414 @ 32.60
AllPeerWkts:     11463 @ 30.37
Top Order Wkts:    320 (57.2%)  Low Order Wkts:  145 (25.9%)
Top Order Home Wkts: 130 (58.3%)  Top Order Away Wkts: 190 (56.5%)
Highest vs West Indies:  104 @ 21.22
Team wkts-5+:  96  Pair-Successes (50% of Team or more): 67 (69.8%)
Pair wkts-5+: 66 Shared: 45 Akram-dominant: 12 Younis-dominant: 9
Ah we now come to probably the most colourful bowling pair which ever took the red cherry. Two totally different individuals and bowlers, yet together they became arguably the most fearsome and feared bowling pair ever.
The first thing that strikes is the difference in the two bowlers when they bowled together and separately. Waqar was quite effective bowling alone, operating at around 90%. However Wasim was lost without Waqar. Most of these matches were during the early years. Wasim was acting at only around 75% of his pair averages when he was bowling alone. In fact it can be seen that this is by far the lowest figure amongst all pairs for one bowler.
The pair captured had a success rate of nearly 70%. Akram was slightly more dominant than Younis by a 12-9 margin. Their win %s were all below 50. They had an excellent WpT figure of well over 9 together.
Akram and Younis have captured all 10 wickets in the innings twice. Their best innings performance has been Test # 1257 against Sri Lanka at Kandy during 1994 when they bowled unchanged on the opening day and captured 10 for 66 (4 for 32 & 6 for 34). Their best match performance has been 17 wickets (8 & 9) in Test # 1207 against New Zealand at Hamilton during 1993. In addition, they have captured 16 wickets thrice and 15 wickets 6 times. Imagine: 15 or more wickets in a match captured an astonishing 10 times!
 Summary of bowling career of Wasim Akram and Waqar Younis
© Anantha Narayanan
Willis & Botham
P05. Willis 222 @ 24.63 & Botham 254 @ 25.67 Total: 476 @ 25.18
-------------------------------------------------------------------
Willis      : 0676(1971)-0991(1984) 222 @ 24.63 (103 @ 26.44) 93.2%
Botham      : 0806(1977)-1190(1992) 254 @ 25.67 (129 @ 33.78) 76.0%
Pair Career:  0806(1977) to 0991(1984)
All matches:          223      Wins:  61 (27.4 %)
Pair matches:          60      Wins:  25 (41.7 %)
Pair Home matches:     33      Wins:  17 (51.5 %)
Pair Away matches:     27      Wins:   8 (29.6 %)
Non-Pair matches:     162      Wins:  36 (22.2 %)
Non-Pair Home matches: 91      Wins:  16 (17.6 %)
Non-Pair Away matches: 71      Wins:  20 (28.2 %)
Matches on their own  Willis: 30  Botham: 41
Pair   Home wkts:  288 @ 23.43  Away wkts:  188 @ 27.87
Others Home wkts:  227 @ 29.69  Away wkts:  224 @ 29.03
Team Wkts:         927 @ 27.22  WpT: 7.93  Pair %: 51.3
TeamPeerWkts:      451 @ 29.36
AllPeerWkts:      4559 @ 30.16
Top Order Wkts:    299 (62.8%)  Low Order Wkts:   93 (19.5%)
Top Order Home Wkts: 180 (62.5%)  Top Order Away Wkts: 119 (63.3%)
Highest vs Australia:  183 @ 25.24
Team wkts-5+:  92  Pair-Successes (50% of Team or more): 55 (59.8%)
Pair wkts-5+: 55 Shared: 28 Willis-dominant: 9 Botham-dominant: 18
Unlike Akram, Willis' figures do not drop off at the start of the career possibly because he had a good set of bowlers bowling with him, led by Snow during his early years. However Botham, without Willis at the other end, was as spent a force as Akram. His average increases by over 30%. Their pair-success value is around 60. The RpT value is below 8. However Botham was the more dominant bowler by a big margin of 18-9 in those situations where they succeeded.
Willis & Botham have captured all 10 wickets in the innings no fewer than three times. Their best innings performance has been Test # 826 against Pakistan at Lord's during 1978 when they captured 10 for 60 (2 for 26 & 8 for 34). Their best match performance has been 16 wickets (5 and 11) in Test # 830 against New Zealand at Lord's during 1978.
 Summary of bowling career of Bob Willis and Ian Botham
© Anantha Narayanan
Donald & Pollock
P06. Donald 208 @ 22.02 & Pollock 189 @ 21.66 Total: 397 @ 21.85
-------------------------------------------------------------------
Donald      : 1188(1992)-1590(2002) 208 @ 22.02 (122 @ 22.66) 97.2%
Pollock     : 1312(1995)-1860(2008) 189 @ 21.66 (232 @ 24.31) 89.1%
Pair Career:  1312(1995) to 1582(2002)
All matches:          155      Wins:  72 (46.5 %)
Pair matches:          47      Wins:  23 (48.9 %)
Pair Home matches:     28      Wins:  17 (60.7 %)
Pair Away matches:     19      Wins:   6 (31.6 %)
Non-Pair matches:     107      Wins:  49 (45.8 %)
Non-Pair Home matches: 30      Wins:  13 (43.3 %)
Non-Pair Away matches: 77      Wins:  36 (46.8 %)
Matches on their own  Donald: 25  Pollock: 60
Pair   Home wkts:  242 @ 20.79  Away wkts:  155 @ 23.49
Others Home wkts:  217 @ 29.14  Away wkts:  148 @ 34.64
Team Wkts:         762 @ 26.41  WpT: 8.45  Pair %: 52.1
TeamPeerWkts:      365 @ 31.37
AllPeerWkts:      6800 @ 30.22
Top Order Wkts:    265 (66.8%)  Low Order Wkts:   80 (20.2%)
Top Order Home Wkts: 163 (67.4%)  Top Order Away Wkts: 102 (65.8%)
Highest vs England:  116 @ 22.76
Team wkts-5+:  78  Pair-Successes (50% of Team or more): 46 (59.0%)
Pair wkts-5+: 44 Shared: 36 Donald-dominant: 3 Pollock-dominant: 5
Look at how close Donald's and Pollock's figures are. The averages are all around 22, the best in this analysis. Donald bowled as effectively without Pollock while Pollock needed the pace of Donald a bit more. Pollock has played many more matches without Donald than any other bowler in this 20 bowler collection. Look at the dominance analysis. They have the highest shared % of all pairs. Very few innings in which either bowler has dominated: only 3-5. A very high level of top order batsmen scalps. And very impressive away averages for the pair.
Donald & Pollock have captured all 10 wickets in the innings twice. Their best innings performance has been Test # 1471 against England at Wanderer's during 1999 when they captured 10 for 69 (6 for 53 and 4 for 16). Their best match performance has been an unprecedented 19 wickets (10 and 9) in the same Test. This is the only instance of one of these pairs capturing 19 wickets in a match.
 Summary of bowling career of Allan Donald and Shaun Pollock
© Anantha Narayanan
Chandrasekhar & Bedi
P07. Chandrasekhar 184 @ 28.71 & Bedi 184 @ 27.22 Total: 368 @ 27.96
-------------------------------------------------------------------
Chandrasekhar: 0552(1964)-0851(1979) 184 @ 28.71 ( 58 @ 33.05) 86.9%
Bedi        :  0612(1967)-0854(1979) 184 @ 27.22 ( 82 @ 32.05) 84.9%
Pair Career:   0612(1967) to 0837(1978)
All matches:           87      Wins:  21 (24.1 %)
Pair matches:          42      Wins:  11 (26.2 %)
Pair Home matches:     20      Wins:   7 (35.0 %)
Pair Away matches:     22      Wins:   4 (18.2 %)
Non-Pair matches:      45      Wins:  10 (22.2 %)
Non-Pair Home matches:  9      Wins:   2 (22.2 %)
Non-Pair Away matches: 36      Wins:   8 (22.2 %)
Matches on their own  Chandrasekhar: 16  Bedi: 25
Pair   Home wkts:  191 @ 25.09  Away wkts:  177 @ 31.07
Others Home wkts:  109 @ 36.02  Away wkts:  123 @ 47.26
Team Wkts:         600 @ 33.38  WpT: 8.76  Pair %: 61.3
TeamPeerWkts:      232 @ 41.98
AllPeerWkts:      5835 @ 30.23
Top Order Wkts:    224 (60.9%)  Low Order Wkts:   77 (20.9%)
Top Order Home Wkts: 111 (58.1%)  Top Order Away Wkts: 113 (63.8%)
Highest vs England:  162 @ 26.40
Team wkts-5+:  60  Pair-Successes (50% of Team or more): 46 (76.7%)
Pair wkts-5+: 45 Shared: 33 Chandrasekhar-dominant: 7 Bedi-dominant: 5
The romantic era of the 60s-70s when spin was king, queen and everything else.
Indian wins were not too many during this era and this pair did well, especially at home. They both bowled very well together and fell off by 15% when bowling separately. Look at their very decent away performance: an average of 31. And look at the awful away figures of the other bowlers even though there was one Prasanna in that group. And when India captured 5 wickets, these two were successful a huge 75%. They also seem to have shared the wickets fairly equitably amongst themselves.
Each was lost without the other. In three matches, Bedi had figures of 1 for 163, 1 for 152 and 1 for 146 without Chandra. He did quite well when Chandra joined him in between.. In between the latter two expensive 1-wicket hauls, this time Chandra on his own, captured 2 for 102.
Chandra & Bedi have captured all 10 wickets in the innings no fewer than three times. Their best innings performance has been Test # 812 against Australia at MCG during 1978 when they captured 10 for 110 (6 for 52 & 4 for 58). In the same match they also captured 18 wickets (12 and 6).
 Summary of bowling career of Bishen Singh Bedi and BS Chandrasekhar
© Anantha Narayanan
Hadlee & Cairns
P08. Hadlee 207 @ 22.02 & Cairns 130 @ 32.58 Total: 337 @ 26.10
-------------------------------------------------------------------
Hadlee      : 0710(1973)-1147(1990) 207 @ 22.02 (224 @ 22.55) 97.7%
Cairns      : 0730(1974)-1031(1985) 130 @ 32.58 (  0 @  0.00)  0.0%
Pair Career:  0730(1974) to 1031(1985)
All matches:          100      Wins:  22 (22.0 %)
Pair matches:          42      Wins:  12 (28.6 %)
Pair Home matches:     23      Wins:   9 (39.1 %)
Pair Away matches:     19      Wins:   3 (15.8 %)
Non-Pair matches:      58      Wins:  10 (17.2 %)
Non-Pair Home matches: 11      Wins:   1 ( 9.1 %)
Non-Pair Away matches: 47      Wins:   9 (19.1 %)
Matches on their own  Hadlee: 44  Cairns: 1
Pair   Home wkts:  188 @ 23.48  Away wkts:  149 @ 29.40
Others Home wkts:  137 @ 32.07  Away wkts:  127 @ 39.46
Team Wkts:         601 @ 30.28  WpT: 8.02  Pair %: 56.1
TeamPeerWkts:      264 @ 35.63
AllPeerWkts:      7911 @ 30.35
Top Order Wkts:    204 (60.5%)  Low Order Wkts:   71 (21.1%)
Top Order Home Wkts: 118 (62.8%)  Top Order Away Wkts:  86 (57.7%)
Highest vs England:   72 @ 27.76
Team wkts-5+:  59  Pair-Successes (50% of Team or more): 38 (64.4%)
Pair wkts-5+: 38 Shared: 22 Hadlee-dominant: 14 Cairns-dominant: 2
This is the only pair in which one bowler, Cairns, has got all his wickets, bowling with the other bowler. He bowled, by himself, in one match (#758) and got 0 for 44. As expected Hadlee dominates by a huge factor of 14-2. I myself am interested in knowing about those two occasions. In match # 958, Cairns took 7 for 74 and Hadlee 0 for 44. A few matches later Cairns captured 7 for 143 and Hadlee, 2 for 97. That is all.
They did quite well at home and held their own away from home. There is no doubt Hadlee was the mainstay but Cairns played the supporting role very effectively.
Hadlee & Cairns have never captured all 10 wickets in an innings. Their best innings performance has been Test # 875 against West Indies at Christchurch during 1980 when they captured 9 for 143 (3 for 58 & 6 for 85). Their best match performance has been 14 wickets (11 and 3) in the earlier match of that series, Test # 873 at Dunedin. A rare win for New Zealand over the mighty West Indies.
 Summary of bowling career of Richard Hadlee and Lance Cairns
© Anantha Narayanan
Garner & Marshall
P09. Garner 152 @ 21.38 & Marshall 170 @ 22.02 Total: 322 @ 21.72
-------------------------------------------------------------------
Garner      : 0797(1977)-1072(1987) 152 @ 21.38 (107 @ 20.40) 104.8%
Marshall    : 0837(1978)-1175(1991) 170 @ 22.02 (206 @ 20.06) 109.8%
Pair Career:  0880(1980) to 1072(1987)
All matches:          117      Wins:  56 (47.9 %)
Pair matches:          36      Wins:  20 (55.6 %)
Pair Home matches:     18      Wins:  12 (66.7 %)
Pair Away matches:     18      Wins:   8 (44.4 %)
Non-Pair matches:      81      Wins:  36 (44.4 %)
Non-Pair Home matches: 14      Wins:   5 (35.7 %)
Non-Pair Away matches: 67      Wins:  31 (46.3 %)
Matches on their own  Garner: 22  Marshall: 45
Pair   Home wkts:  161 @ 21.09  Away wkts:  161 @ 22.35
Others Home wkts:  149 @ 27.46  Away wkts:  140 @ 27.13
Team Wkts:         611 @ 24.36  WpT: 8.94  Pair %: 52.7
TeamPeerWkts:      289 @ 27.30
AllPeerWkts:      4687 @ 31.27
Top Order Wkts:    192 (59.6%)  Low Order Wkts:   69 (21.4%)
Top Order Home Wkts: 102 (63.4%)  Top Order Away Wkts:  90 (55.9%)
Highest vs England:  141 @ 19.30
Team wkts-5+:  60  Pair-Successes (50% of Team or more): 39 (65.0%)
Pair wkts-5+: 38 Shared: 25 Garner-dominant: 5 Marshall-dominant: 8
The first of the two special selections. These two greats might very well have warranted the top selection on their own. Look at their numbers. All pair values are around the 22 mark, almost the same as Donald & Pollock. The surprise is the overall win % mark. I would have expected a slightly higher figure, somewhere around the 60-65% mark. But does not matter. A wonderful away average and an out-of-the-world performance against England mark this pair's achievements.
As expected, Garner & Marshall have never captured all 10 wickets in an innings. Their best innings performance has been Test # 991 against England at Leeds during 1984 when they captured 9 for 90 (2 for 32 and 7 for 53). Their best match performance has been 13 wickets (5 and 8) in Test # 988 against Australia at Kingston during 1984.
 Summary of bowling career of Joel Garner and Malcolm Marshall
© Anantha Narayanan
Miller & Lindwall
P10. Miller 150 @ 23.69 & Lindwall 195 @ 22.48 Total: 345 @ 23.00
-------------------------------------------------------------------
Miller      : 0275(1946)-0430(1956) 150 @ 23.69 ( 20 @ 17.65) 134.2%
Lindwall    : 0275(1946)-0487(1960) 195 @ 22.48 ( 33 @ 26.30) 85.5%
Pair Career:  0275(1946) to 0430(1956)
All matches:           78      Wins:  44 (56.4 %)
Pair matches:          51      Wins:  28 (54.9 %)
Pair Home matches:     26      Wins:  17 (65.4 %)
Pair Away matches:     25      Wins:  11 (44.0 %)
Non-Pair matches:      27      Wins:  16 (59.3 %)
Non-Pair Home matches:  4      Wins:   1 (25.0 %)
Non-Pair Away matches: 23      Wins:  15 (65.2 %)
Matches on their own  Miller: 4  Lindwall: 10
Pair   Home wkts:  180 @ 20.84  Away wkts:  165 @ 25.36
Others Home wkts:  278 @ 26.02  Away wkts:  218 @ 30.72
Team Wkts:         841 @ 26.00  WpT: 6.76  Pair %: 41.0
TeamPeerWkts:      496 @ 28.08
AllPeerWkts:      3406 @ 29.41
Top Order Wkts:    229 (66.4%)  Low Order Wkts:   63 (18.3%)
Top Order Home Wkts: 119 (66.1%)  Top Order Away Wkts: 110 (66.7%)
Highest vs England:  174 @ 22.39
Team wkts-5+:  85  Pair-Successes (50% of Team or more): 33 (38.8%)
Pair wkts-5+: 32 Shared: 17 Miller-dominant: 4 Lindwall-dominant: 11
Lindwall & Miller have very good figures but these were good years for bowling. Good win % values indicate the superiority of Australia during the 1946-55 period. Their Wickets per Test is the lowest amongst these pairs and does not even reach 7. This is also reflected in the low % of pair successes. They have always been quite consistent at home or away.
Since Miller & Lindwall were never the dominating bowling pair in the attack, they have never captured all 10 wickets in an innings. Their best innings performance has been Test # 408 against West Indies at Kingston during 1955 when they captured 8 for 171 (6 for 107 & 2 for 64). Their best match performance has been 14 wickets (7 and 7) in Test # 341 against West Indies at SCG during 1952.
 Summary of bowling career of Ray Lindwall and Keith Miller
© Anantha Narayanan
Please peruse the following few lines. This is worthy of a special comment. Two wonderful bowlers, almost working like Siamese twins together. I wish I had got them in. At least I have given them a belated salute.
Statham 141 @ 25.72 & Trueman 143 @ 25.76 Total: 284 @ 25.74
-------------------------------------------------------------------
Statham    : 0332(1951)-0596(1965) 141 @ 25.72 (111 @ 23.74) 108.3%
Trueman    : 0351(1952)-0592(1965) 143 @ 25.76 (164 @ 17.93) 143.7%
Pair Career: 0380(1954) to 0547(1963)
Pair wkts-5+: 34 Shared: 28 Statham-dominant: 3 Trueman-dominant: 3
The summary table with key data elements is displayed here. No special comments are needed.
| Bowler 1 | Wkts | Avge | Bowler 2 | Wkts | Avge | P-Wkts | P-Avge | Tests | Wins | % Wins | P>=50% |
|---|---|---|---|---|---|---|---|---|---|---|---|
| Twkts>4 | |||||||||||
| Warne | 513 | 24.88 | McGrath | 488 | 21.38 | 1001 | 23.17 | 104 | 71 | 68.3 | 64.5 |
| Muralitharan | 586 | 22.05 | Vaas | 309 | 28.01 | 895 | 24.11 | 94 | 41 | 43.6 | 79.3 |
| Walsh | 373 | 24.29 | Ambrose | 389 | 21.12 | 762 | 22.67 | 95 | 42 | 44.2 | 59.2 |
| Akram | 282 | 21.33 | Younis | 277 | 22.93 | 559 | 22.12 | 60 | 28 | 46.7 | 69.8 |
| Willis | 222 | 24.63 | Botham | 254 | 25.67 | 476 | 25.18 | 60 | 25 | 41.7 | 59.8 |
| Donald | 208 | 22.02 | Pollock | 189 | 21.66 | 397 | 21.85 | 47 | 23 | 48.9 | 59.0 |
| Chandrasekhar | 184 | 28.71 | Bedi | 184 | 27.22 | 368 | 27.96 | 42 | 11 | 26.2 | 76.7 |
| Hadlee | 207 | 22.02 | Cairns | 130 | 32.58 | 337 | 26.10 | 42 | 12 | 28.6 | 64.4 |
| Garner | 152 | 21.38 | Marshall | 170 | 22.02 | 322 | 21.72 | 36 | 20 | 55.6 | 65.0 |
| Miller | 150 | 23.69 | Lindwall | 195 | 22.48 | 345 | 23.00 | 51 | 28 | 54.9 | 38.8 |
| Statham | 141 | 25.72 | Trueman | 143 | 25.76 | 284 | 25.74 | 35 | 13 | 37.1 | 63.5 |
To download the complete table, the widest Excel sheet I have seen for a long time (75 columns!), please CLICK HERE.
Finally, let me confess that I might have missed many more but here is a list of stand outs revealed by this analysis:
1. The absence of a big gap between Warne & McGrath and other peer bowlers indicating the abundance of quality. The near-70% success rate of Warne & McGrath.
2. The impact Murali at the other end had on Vaas' bowling.
3. The astounding level of success Murali & Vaas had when their team captured 5 wickets or more.
4. The extent of dependency Wasim Akram had on the support given by Waqar Younis.
5. The unbelievable 10 occasions when Wasim and Waqar captured 15 or more wickets in a match.
6. The closeness of numbers between Donald & Pollock confirming the extent of under-estimating of Pollock.
7. Their unique 19-wickets capture in this elite group. I know that there have been 20-wickets captured in a match by a pair (Trumble/Noble, Hirst/Blythe, Faulkner/Vogler, Laker/Lock, Massie/Lillee et al), but those bowlers are outside this group.
8. The extraordinary variation in the pair's away performance and other bowlers' away performance for Murali & Vaas and Chandra & Bedi.
9. The closeness of Home/Away performances for the two West Indian pairs. In fact it is unbelievable that Walsh & Ambrose have performed better away than at home.
10.The confirmation that Botham was three-fourth the bowler he was when Willis was absent.
11. The 22 level averages for the two West Indian pairs and Donald & Pollock.
Finally my usual request. Give respect to this wonderful collection of great bowlers. The only way this can be done is to dedicate your comments to the bowlers and let them take centre stage. Do not bring in frivolous comparisons, using vague numbers that batsman A played P&Q better than B or that C was shaking/shaky against X&Y or that S&T were ineffective against batsman D. I will be ruthless and cut off such comments right at the beginning. There is so much data provided here and I have just skimmed the top. Look for hidden gems here instead of indulging in fantasies.
Let me add that I have set up the Bowling pair analysis program such that I have a dummy pair which can be replaced by any duo and this pair can be analysed instantly. So you are welcome to ask summary details for any meaningful pair. Of course, if you ask for Hirwani & Arshad Ayub or Cuffy & Ramnarine or Allott & Pocock, it is unlikely that I would oblige.
Thank you.
Anantha Narayanan has written for ESPNcricinfo and CastrolCricket and worked with a number of companies on their cricket performance ratings-related systems