Sri Lanka's best struggle in England
How players have fared in England compared to the rest of their careers
Travis Basevi and George Binoy
22-Jun-2011
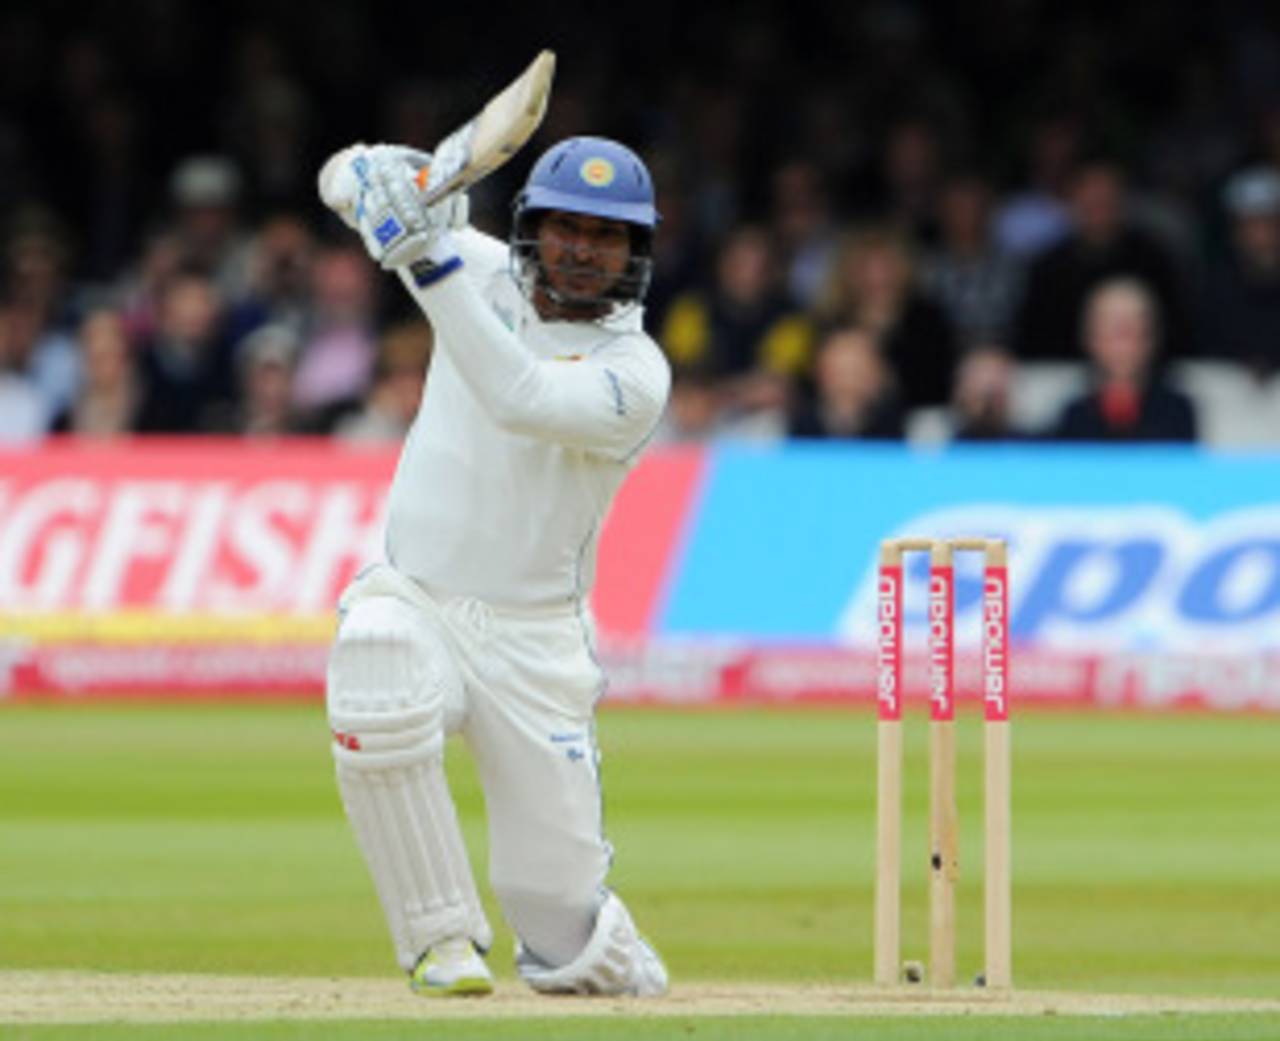
Kumar Sangakkara's maiden century in England improved his record in the country • Getty Images
Kumar Sangakkara finally did it. After 17 innings with a high-score unworthy of a batsman, who averages more than Brian Lara, Ricky Ponting, and Rahul Dravid, Sangakkara eventually scored a Test century in England. It wasn't at Lord's, or at any of England's other traditional venues, but Sangakkara's 119 in Southampton - he now shares the record for the highest score at the Rose Bowl - saved Sri Lanka the Test and improved his record in his bogey country. It isn't a patch on his career average, though. This week's column is on cricketers whose performance in England was far worse, or better, than their career average.
Sangakkara began this tour of England with a Test average of 57.25. His average in England, though, was 30.54 in 12 innings, with a best of 66. After failures in Cardiff and at Lord's it slipped to 26.60, before climbing to 30.58 at the Rose Bowl. Sangakkara's cover-drive can light up the dreariest of days - and there were plenty during a wet series - but it was on display too infrequently. He wasn't alone in his struggles either.
Mahela Jayawardene had a terrible series, making 103 in six innings at an average of 17.16, with a best of 49. Before it began, he was one of Sri Lanka's better batsmen in England, averaging 42.58 over two tours. His century during a follow-on at Lord's had saved the Test in 2006. He now averages 34.11 in England, 18.50 less than his career mean of 52.62.
Before he made 31 and 87 not out at the Rose Bowl, Thilan Samaraweera had an average of 14.42 in four Tests in England. This tour was his second, and an improvement on his trip in 2006, when he had made 17 runs in four innings. His overall average in England is now 27.37, 26.70 fewer than his career average of 54.08, a difference surpassed only by Jacques Kallis.
| Player | Span | Mat | Inns | Runs | HS | Ave | 100 | Eng | Inns | Runs | HS | Ave | 100 | Diff | |||
|---|---|---|---|---|---|---|---|---|---|---|---|---|---|---|---|---|---|
| JH Kallis (SA) | 1998-2008 | 145 | 246 | 11947 | 201* | 57.43 | 40 | 12 | 20 | 586 | 132 | 29.30 | 1 | -28.137 | |||
| TT Samaraweera (SL) | 2006-2011 | 66 | 104 | 4597 | 231 | 54.08 | 12 | 5 | 10 | 219 | 87* | 27.37 | 0 | -26.707 | |||
| KC Sangakkara (SL) | 2002-2011 | 97 | 162 | 8428 | 287 | 56.18 | 25 | 9 | 18 | 520 | 119 | 30.58 | 1 | -25.598 | |||
| 207 | 58.61 | 15 | 9 | 16 | 533 | 129 | 33.31 | 1 | -25.305 | ||||||||
| PR Umrigar (India) | 1952-1959 | 59 | 94 | 3631 | 223 | 42.22 | 12 | 8 | 15 | 273 | 118 | 18.20 | 1 | -24.020 | |||
| RM Cowper (Aus) | 1964-1968 | 27 | 46 | 2061 | 307 | 46.84 | 5 | 5 | 9 | 193 | 57 | 24.12 | 0 | -22.715 | |||
| CL Walcott (WI) | 1950-1957 | 44 | 74 | 3798 | 220 | 56.68 | 15 | 9 | 16 | 476 | 168* | 34.00 | 1 | -22.686 | |||
| KD Walters (Aus) | 1968-1977 | 74 | 125 | 5357 | 250 | 48.26 | 15 | 18 | 30 | 745 | 88 | 25.68 | 0 | -22.571 | |||
| JA Rudolph (SA) | 2003-2003 | 35 | 63 | 2028 | 222* | 36.21 | 5 | 5 | 9 | 132 | 55 | 14.66 | 0 | -21.547 | |||
| 201* | 29.54 | 6 | 4 | 8 | 71 | 26 | 8.87 | 0 | -20.672 | ||||||||
| GA Faulkner (SA) | 1907-1924 | 25 | 47 | 1754 | 204 | 40.79 | 4 | 10 | 19 | 348 | 122* | 20.47 | 1 | -20.320 | |||
| MEK Hussey (Aus) | 2009-2010 | 59 | 103 | 4650 | 195 | 51.09 | 13 | 7 | 12 | 345 | 121 | 31.36 | 1 | -19.735 | |||
| MC Carew (WI) | 1963-1969 | 19 | 36 | 1127 | 109 | 34.15 | 1 | 4 | 8 | 104 | 44 | 14.85 | 0 | -19.294 | |||
| CG Borde (India) | 1959-1967 | 55 | 97 | 3061 | 177* | 35.59 | 5 | 7 | 13 | 200 | 75 | 16.66 | 0 | -18.926 | |||
| P Roy (India) | 1952-1959 | 43 | 79 | 2442 | 173 | 32.56 | 5 | 9 | 17 | 233 | 54 | 13.70 | 0 | -18.854 | |||
| 374 | 52.62 | 28 | 10 | 19 | 614 | 119 | 34.11 | 2 | -18.511 | ||||||||
| GC White (SA) | 1907-1912 | 17 | 31 | 872 | 147 | 30.06 | 2 | 8 | 14 | 151 | 59* | 11.61 | 0 | -18.453 | |||
| Kamran Akmal (Pak) | 2006-2010 | 53 | 92 | 2648 | 158* | 30.79 | 6 | 9 | 16 | 199 | 58 | 12.43 | 0 | -18.353 | |||
| Hanif Mohammad (Pak) | 1954-1967 | 55 | 97 | 3915 | 337 | 43.98 | 12 | 12 | 23 | 586 | 187* | 26.63 | 1 | -17.352 | |||
| JJ Crowe (NZ) | 1983-1986 | 39 | 65 | 1601 | 128 | 26.24 | 3 | 5 | 8 | 73 | 23 | 9.12 | 0 | -17.120 |
Kallis has an average of 29.30 in England, compared to his career's 57.43. In his first innings there, at Edgbaston in 1998, Kallis made 61, and then scored 132 at Old Trafford two Tests later. It remains his only century in the country. He finished the 1998 tour with an average of 42. On the 2003 tour of England, Kallis' average dropped to 31. He made only 188 in six innings with a best of 66. The tour in 2008 was a nightmare for him. Troubled by Andrew Flintoff's hostility, Kallis managed 104 runs in four Tests, of which 64 came in one innings. His other scores were 7, 13, 4, 5, 2 and 9.
Dean Jones toured England once, and had a memorable time. His six Tests there were during the 1989 Ashes, which Allan Border's team won 4-0. Jones was the second-highest run-scorer in the series, after Mark Taylor, with 566 runs at 70.75 in nine innings. Because he did not tour England again, Jones' average in the country ended 24.18 runs more than his career average of 46.55. No visiting player has a greater difference.
Jonathan Trott's career average is 62.23, second only to Don Bradman's 99.94, among batsmen who played at least 20 Test innings. In England, it rockets to 78.28, and once again Trott is behind only Bradman (102.84) among batsmen who've played at least 10 Tests in England.
| Player | Span | Mat | Inns | Runs | HS | Ave | 100 | Eng | Inns | Runs | HS | Ave | 100 | Diff | |||
|---|---|---|---|---|---|---|---|---|---|---|---|---|---|---|---|---|---|
| DR Jardine (Eng) | 1928-1933 | 22 | 33 | 1296 | 127 | 48.00 | 1 | 8 | 10 | 490 | 127 | 81.66 | 1 | 33.666 | |||
| SJ Rhodes (Eng) | 1994-1994 | 11 | 17 | 294 | 65* | 24.50 | 0 | 6 | 8 | 222 | 65* | 55.50 | 0 | 31.000 | |||
| DM Jones (Aus) | 1989-1989 | 52 | 89 | 3631 | 216 | 46.55 | 11 | 6 | 9 | 566 | 157 | 70.75 | 2 | 24.198 | |||
| V Pollard (NZ) | 1965-1973 | 32 | 59 | 1266 | 116 | 24.34 | 2 | 9 | 16 | 621 | 116 | 47.76 | 2 | 23.423 | |||
| 239 | 42.17 | 16 | 9 | 15 | 915 | 136 | 65.35 | 3 | 23.181 | ||||||||
| SR Waugh (Aus) | 1989-2001 | 168 | 260 | 10927 | 200 | 51.06 | 32 | 22 | 32 | 1633 | 177* | 74.22 | 7 | 23.166 | |||
| Saleem Malik (Pak) | 1987-1996 | 103 | 154 | 5768 | 237 | 43.69 | 15 | 13 | 18 | 931 | 165 | 66.50 | 3 | 22.803 | |||
| GC Smith (SA) | 2003-2008 | 91 | 159 | 7457 | 277 | 49.71 | 22 | 9 | 17 | 1083 | 277 | 72.20 | 4 | 22.486 | |||
| MTG Elliott (Aus) | 1997-1997 | 21 | 36 | 1172 | 199 | 33.48 | 3 | 6 | 10 | 556 | 199 | 55.60 | 2 | 22.114 | |||
| DPB Morkel (SA) | 1929-1929 | 16 | 28 | 663 | 88 | 24.55 | 0 | 5 | 8 | 321 | 88 | 45.85 | 0 | 21.301 | |||
| 143* | 37.84 | 1 | 5 | 9 | 353 | 143* | 58.83 | 1 | 20.989 | ||||||||
| GC Small (Eng) | 1986-1990 | 17 | 24 | 263 | 59 | 15.47 | 0 | 7 | 9 | 169 | 59 | 33.80 | 0 | 18.329 | |||
| Ijaz Ahmed (Pak) | 1987-1996 | 60 | 92 | 3315 | 211 | 37.67 | 12 | 7 | 10 | 494 | 141 | 54.88 | 1 | 17.218 | |||
| WA Johnston (Aus) | 1948-1953 | 40 | 49 | 273 | 29 | 11.37 | 0 | 8 | 11 | 84 | 29 | 28.00 | 0 | 16.625 | |||
| KR Stackpole (Aus) | 1972-1972 | 43 | 80 | 2807 | 207 | 37.42 | 7 | 5 | 10 | 485 | 114 | 53.88 | 1 | 16.462 | |||
| IJL Trott (Eng) | 2009-2011 | 21 | 34 | 1867 | 226 | 62.23 | 6 | 10 | 16 | 1096 | 226 | 78.28 | 4 | 16.052 | |||
| 119 | 37.80 | 3 | 11 | 14 | 699 | 119 | 53.76 | 2 | 15.962 | ||||||||
| S Chanderpaul (WI) | 1995-2009 | 130 | 221 | 9126 | 203* | 49.06 | 22 | 13 | 23 | 1164 | 136* | 64.66 | 3 | 15.602 | |||
| KS More (India) | 1986-1990 | 49 | 64 | 1285 | 73 | 25.70 | 0 | 6 | 9 | 247 | 61* | 41.16 | 0 | 15.466 | |||
| DAJ Holford (WI) | 1966-1966 | 24 | 39 | 768 | 105* | 22.58 | 1 | 5 | 8 | 227 | 105* | 37.83 | 1 | 15.245 |
Lance Klusener was formidable in ODIs in England. He scored aggressive cameos and rarely got out. He averaged 41 in his 171-ODI career but in England, where he was unbeaten eight times, he averaged 96 in 12 innings, 55 runs more.
Steve Waugh was terrific in England in both Tests and ODIs. He averaged 74.22 in Tests, compared to a career average of 51.06, and 54.13 in 22 ODIs, compared to a career average of 32.90. He scored only one ODI century in England though - the 120 in the Super-Six match against South Africa, when Herschelle Gibbs famously dropped the World Cup in 1999.
| Player | Span | Mat | Inns | Runs | HS | Ave | 100 | Eng | Inns | Runs | HS | Ave | 100 | Diff | |||
|---|---|---|---|---|---|---|---|---|---|---|---|---|---|---|---|---|---|
| 103* | 41.10 | 2 | 13 | 12 | 384 | 55* | 96.00 | 0 | 54.896 | ||||||||
| TM Moody (Aus) | 1989-1999 | 76 | 64 | 1211 | 89 | 23.28 | 0 | 10 | 8 | 157 | 56* | 52.33 | 0 | 29.044 | |||
| RG Twose (NZ) | 1999-1999 | 87 | 81 | 2717 | 103 | 38.81 | 1 | 8 | 8 | 264 | 80* | 66.00 | 0 | 27.185 | |||
| M Kaif (India) | 2002-2004 | 125 | 110 | 2753 | 111* | 32.01 | 2 | 12 | 10 | 353 | 87* | 58.83 | 0 | 26.821 | |||
| HA Gomes (WI) | 1983-1984 | 83 | 64 | 1415 | 101 | 28.87 | 1 | 11 | 10 | 333 | 78 | 55.50 | 0 | 26.622 | |||
| M Azharuddin (India) | 1986-1999 | 334 | 308 | 9378 | 153* | 36.92 | 7 | 15 | 14 | 497 | 83* | 62.12 | 0 | 25.203 | |||
| 175* | 23.79 | 1 | 17 | 15 | 519 | 175* | 47.18 | 1 | 23.389 | ||||||||
| SR Waugh (Aus) | 1989-2001 | 325 | 288 | 7569 | 120* | 32.90 | 3 | 25 | 21 | 812 | 120* | 54.13 | 1 | 21.224 | |||
| A Symonds (Aus) | 2001-2005 | 198 | 161 | 5088 | 156 | 39.75 | 6 | 17 | 12 | 473 | 104* | 59.12 | 1 | 19.375 | |||
| RC Irani (Eng) | 1996-2002 | 31 | 30 | 360 | 53 | 14.40 | 0 | 11 | 10 | 231 | 53 | 33.00 | 0 | 18.600 | |||
| RD Jacobs (WI) | 1999-2004 | 147 | 112 | 1865 | 80* | 23.31 | 0 | 16 | 10 | 247 | 80* | 41.16 | 0 | 17.854 | |||
| S Madan Lal (India) | 1974-1983 | 67 | 35 | 401 | 53* | 19.09 | 0 | 15 | 11 | 181 | 53* | 36.20 | 0 | 17.104 | |||
| 189* | 47.00 | 11 | 31 | 29 | 1345 | 189* | 64.04 | 4 | 17.047 | ||||||||
| Imran Khan (Pak) | 1974-1987 | 175 | 151 | 3709 | 102* | 33.41 | 1 | 20 | 17 | 433 | 102* | 48.11 | 1 | 14.696 | |||
| JWM Dalrymple (Eng) | 2006-2006 | 27 | 26 | 487 | 67 | 19.48 | 0 | 10 | 9 | 304 | 67 | 33.77 | 0 | 14.297 | |||
| CA Walsh (WI) | 1988-1999 | 205 | 79 | 321 | 30 | 6.97 | 0 | 12 | 8 | 61 | 29* | 20.33 | 0 | 13.355 | |||
| KC Sangakkara (SL) | 2002-2006 | 291 | 272 | 9164 | 138* | 38.02 | 11 | 11 | 11 | 358 | 70 | 51.14 | 0 | 13.117 | |||
| MA Atherton (Eng) | 1990-1998 | 54 | 54 | 1791 | 127 | 35.11 | 2 | 21 | 21 | 908 | 127 | 47.78 | 2 | 12.671 | |||
| 76 | 23.06 | 0 | 13 | 13 | 428 | 76 | 35.66 | 0 | 12.599 | ||||||||
| IR Bell (Eng) | 2006-2010 | 97 | 94 | 3021 | 126* | 35.12 | 1 | 34 | 33 | 1333 | 126* | 47.60 | 1 | 12.479 |
Few people have struggled in England more than Shoaib Malik has. He played 12 ODIs for Pakistan there and scored 98, averaging 8.16, a drastic drop from his career mean of 34.35. On his four visits between 2001 and 2006, Malik passed 20 only twice. He's in good company, though, for there are illustrious batsmen in the table below, because they didn't match their career averages in England.
| Player | Span | Mat | Inns | Runs | HS | Ave | 100 | Eng | Inns | Runs | HS | Ave | 100 | Diff | |||
|---|---|---|---|---|---|---|---|---|---|---|---|---|---|---|---|---|---|
| Shoaib Malik (Pak) | 2001-2006 | 192 | 172 | 5188 | 143 | 34.35 | 7 | 12 | 12 | 98 | 24 | 8.16 | 0 | -26.190 | |||
| RP Arnold (SL) | 1998-2006 | 180 | 155 | 3950 | 103 | 35.26 | 1 | 11 | 10 | 102 | 29 | 11.33 | 0 | -23.934 | |||
| IM Chappell (Aus) | 1972-1975 | 16 | 16 | 673 | 86 | 48.07 | 0 | 8 | 8 | 208 | 62 | 26.00 | 0 | -22.071 | |||
| G Kirsten (SA) | 1994-1999 | 185 | 185 | 6798 | 188* | 40.95 | 13 | 15 | 15 | 294 | 82 | 19.60 | 0 | -21.351 | |||
| RB Richardson (WI) | 1984-1995 | 224 | 217 | 6248 | 122 | 33.41 | 5 | 11 | 11 | 137 | 41 | 12.45 | 0 | -20.957 | |||
| 122 | 28.93 | 5 | 9 | 8 | 73 | 28 | 9.12 | 0 | -19.812 | ||||||||
| ML Hayden (Aus) | 1993-2005 | 161 | 155 | 6133 | 181* | 43.80 | 10 | 20 | 19 | 447 | 66* | 24.83 | 0 | -18.973 | |||
| WJ Cronje (SA) | 1994-1999 | 188 | 175 | 5565 | 112 | 38.64 | 2 | 15 | 15 | 296 | 40 | 19.73 | 0 | -18.912 | |||
| JC Adams (WI) | 1995-2000 | 127 | 105 | 2204 | 82 | 28.62 | 0 | 13 | 10 | 107 | 36 | 11.88 | 0 | -16.734 | |||
| PA de Silva (SL) | 1988-1999 | 308 | 296 | 9284 | 145 | 34.90 | 11 | 9 | 9 | 168 | 56 | 18.66 | 0 | -16.235 | |||
| DS Lehmann (Aus) | 1999-2004 | 117 | 101 | 3078 | 119 | 38.96 | 4 | 13 | 10 | 183 | 76 | 22.87 | 0 | -16.087 | |||
| 185* | 43.74 | 6 | 19 | 16 | 404 | 61 | 28.85 | 0 | -14.887 | ||||||||
| SV Carlisle (Zim) | 1999-2000 | 111 | 107 | 2740 | 121* | 27.67 | 3 | 11 | 8 | 95 | 27 | 13.57 | 0 | -14.105 | |||
| V Sehwag (India) | 2002-2004 | 236 | 230 | 7760 | 175 | 35.11 | 14 | 12 | 12 | 261 | 71 | 21.75 | 0 | -13.363 | |||
| A Ranatunga (SL) | 1983-1999 | 269 | 255 | 7456 | 131* | 35.84 | 4 | 15 | 15 | 343 | 58 | 22.86 | 0 | -12.979 | |||
| DC Boon (Aus) | 1985-1993 | 181 | 177 | 5964 | 122 | 37.04 | 5 | 9 | 9 | 218 | 73 | 24.22 | 0 | -12.821 | |||
| DL Haynes (WI) | 1979-1988 | 238 | 237 | 8648 | 152* | 41.37 | 17 | 18 | 18 | 486 | 88* | 28.58 | 0 | -12.789 | |||
| 105 | 34.73 | 1 | 10 | 9 | 184 | 54 | 23.00 | 0 | -11.732 | ||||||||
| C Kieswetter (Eng) | 2010-2010 | 12 | 12 | 320 | 107 | 26.66 | 1 | 8 | 8 | 121 | 38 | 15.12 | 0 | -11.541 | |||
| DR Smith (WI) | 2004-2007 | 77 | 61 | 925 | 68 | 16.22 | 0 | 10 | 8 | 38 | 10 | 5.42 | 0 | -10.799 |
Travis Basevi is a cricket statistician and UK Senior Programmer for Cricinfo and other ESPN sports websites. George Binoy is an Assistant Editor at ESPNcricinfo