Indian bowling v lower-order fightbacks
West Indies' superb rearguard effort in Jamaica once again exposed the problems that India's bowlers have had with Nos. 5-8 batsmen in overseas Tests
S Rajesh
05-Aug-2016
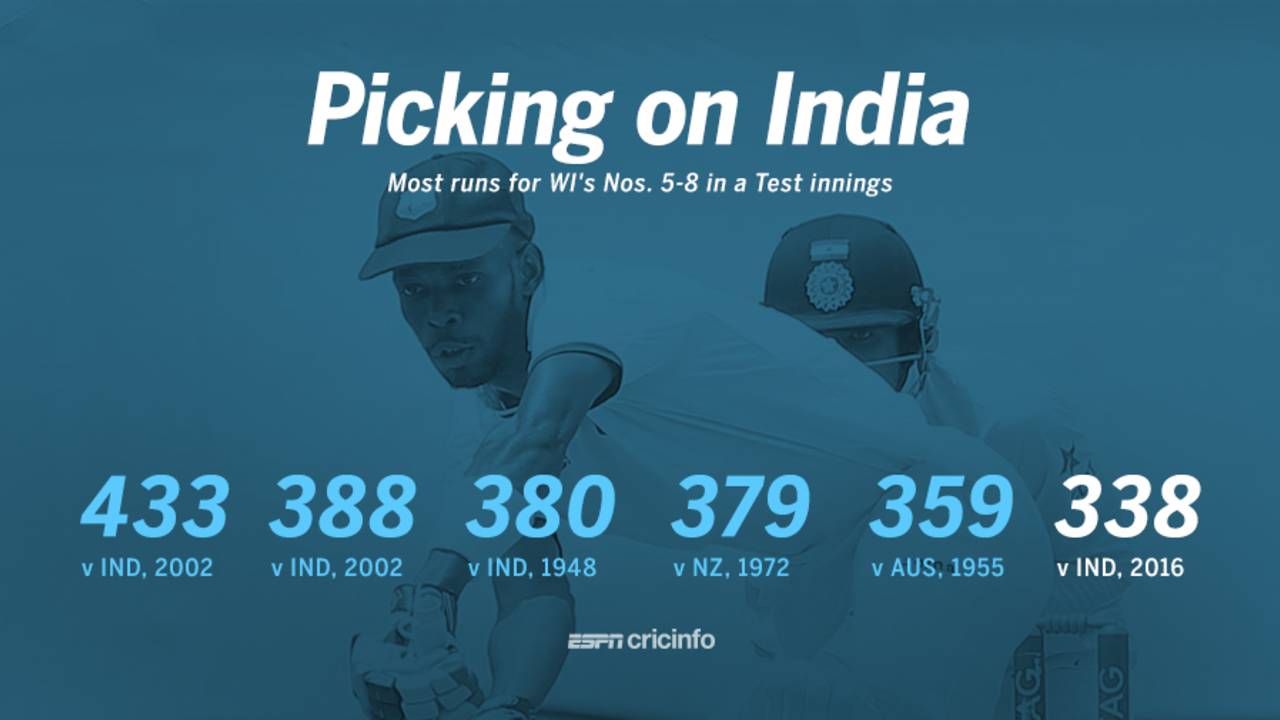
Four of the six instances of most runs by West Indies Nos. 5-8 in a Test innings have been against India • ESPNcricinfo Ltd
At the end of the third day of the Jamaica Test, the only way for West Indies to escape with anything other than a huge defeat, it seemed, would be if it rained for most of the last two days. West Indies were trailing by 304 going into their second innings, and in the three previous innings in the series, they had averaged 44.16 balls per dismissal, which works out to an average of less than 74 overs per completed innings. In the first innings in Kingston, they lasted all of 52.3 overs.
Things seemed to be going to plan for India through the early part of the innings, as West Indies slumped to 48 for 4. Then the script changed dramatically, as West Indies' fifth wicket added 93, the sixth 144, and the seventh 103, undefeated. Led by a magnificent century by Roston Chase, they almost doubled the number of overs faced in the first innings, and ended on a very respectable 388 for 6, saving the Test and ensuring that they go into the third match of the series only one down.
For India it was a discouraging result, but not an unfamiliar one. There have been other instances of opposition teams fighting rearguard battles to save or win Tests, most recently against Sri Lanka in Galle, when Dinesh Chandimal's counterattacking century turned around a deficit of 192 and helped Sri Lanka to a famous win. A little earlier, at the Basin Reserve in Wellington in 2014, New Zealand came back from the brink. Faced with a first-innings deficit of 246, New Zealand had slumped to 87 for 4 and 94 for 5 when Brendon McCullum joined BJ Watling and put together a scarcely believable partnership of 352. With McCullum going on to a triple-hundred and Watling and Jimmy Neesham both getting hundreds, New Zealand saved the game quite comfortably in the end.
In that Wellington Test, New Zealand's Nos. 5-8 added 565, the most ever in any Test innings by these four slots. The second highest is also against India, by Australia in Sydney in 2012, when Michael Clarke got a triple-hundred at No. 5. Since 2000, the four such highest aggregates, as well as five of the top seven, have all been against India.
| Team | Runs | 100s/ 50s | Versus | Venue | Date |
| New Zealand | 565 | 3/ 0 | India | Wellington | Feb 14, 2014 |
| Australia | 479 | 2/ 0 | India | Sydney | Jan 3, 2012 |
| West Indies | 433 | 3/ 0 | India | St John's | May 10, 2002 |
| New Zealand | 423 | 2/ 2 | India | Napier | Mar 26, 2009 |
| New Zealand | 415 | 2/ 0 | Bangladesh | Hamilton | Feb 15, 2010 |
| England | 408 | 2/ 0 | South Africa | Cape Town | Jan 2, 2016 |
| West Indies | 388 | 2/ 0 | India | Georgetown | Apr 11, 2002 |
| Sri Lanka | 387 | 2/ 0 | Bangladesh | Colombo (PSS) | Jul 21, 2002 |
In the Jamaica Test, West Indies' four batsmen from Nos. 5 to 8 scored 338, which is their sixth-best of all time. Four of those top six have come against India. The top two came in the same series, in 2002, when they scored 433 in the fourth Test in Antigua, and 388 in the first Test in Georgetown. In fact, the Jamaica Test presented only the fifth instance of each of those four batsmen passing 50 in a Test innings - three of those five instances have come against India.
| Runs | 100s/ 50s | Versus | Venue | Date |
| 433 | 3/ 0 | India | St John's | May 10, 2002 |
| 388 | 2/ 0 | India | Georgetown | Apr 11, 2002 |
| 380 | 3/ 0 | India | Delhi | Nov 10, 1948 |
| 379 | 2/ 1 | New Zealand | Bridgetown | Mar 23, 1972 |
| 359 | 2/ 0 | Australia | Bridgetown | May 14, 1955 |
| 338 | 1/ 3 | India | Kingston | Jul 30, 2016 |
In the first three innings of this series, India's attack seemed to have plenty of bite, and the ploy of playing five specialist bowlers was a fine, attacking move that gave splendid returns. In the second innings of the Jamaica Test, though, a familiar problem returned to haunt India - the inability to remove the middle and lower middle order, after taking care of the top order quite smartly.
The table below looks at the averages of the top four, and the four batsmen from Nos. 5 to 8, against each opposition in home Tests since the beginning of 2008. Home Tests is key because most of the lower-order batsmen have struggled against India in India. In these away games, these batsmen from Nos. 5 to 8 have averaged 27.47 against India, which is the second lowest among all teams; only against Australia have they done worse. On the other hand, the top four batsmen have averaged 39.10 against India in India, which isn't surprising - top-order batsmen are expected to score more runs.
However, the numbers below show India's repeated inability to get these batsmen out when they are playing at home (i.e. when India are touring). The batsmen from Nos. 5 to 8 average 43.71 against India, compared to the top-four average of 41.94, confirming the fact that India's bowlers find it easier - albeit only slightly - to get the top order out than the lower middle order. The only other team that struggles against them more, compared to the top order, is Sri Lanka. The difference in averages for them is 7.10, showing that the middle and lower middle order does really well against them. The difference against India is 1.77, and these are the only two teams with a difference of more than one.
There is a positive difference against Australia and South Africa too, but that is more because the top four struggle against the new-ball attacks of these teams, averaging less than 35. On the other hand, the middle and lower-middle-order batsmen have struggled against Pakistan even in home conditions, averaging only 29.07 against them, compared to the top order average of 39.01. The lower order has scored only nine hundreds from 38 home Tests against Pakistan, compared to 30 hundreds from 47 Tests against India.
An emphasis on a five-man bowling attack is clearly an attacking move by the Indian think tank, but Chase and Co yet again brought to the fore an Indian weakness that has plagued them for a while now.
| Nos. 1-4 | Nos. 5-8 | |||||
| Opposition | Tests | Average | 100s | Average | 100s | Diff |
| Sri Lanka | 29 | 46.29 | 22 | 53.39 | 19 | 7.10 |
| India | 47 | 41.94 | 40 | 43.71 | 30 | 1.77 |
| Australia | 50 | 33.86 | 22 | 34.85 | 20 | 0.99 |
| South Africa | 35 | 33.30 | 16 | 33.83 | 12 | 0.53 |
| West Indies | 35 | 49.39 | 24 | 47.46 | 14 | -1.93 |
| England | 42 | 39.22 | 35 | 36.73 | 15 | -2.49 |
| New Zealand | 36 | 42.89 | 32 | 38.10 | 15 | -4.79 |
| Bangladesh | 16 | 49.07 | 15 | 44.01 | 9 | -5.06 |
| Zimbabwe | 6 | 44.25 | 6 | 37.45 | 3 | -6.80 |
| Pakistan | 38 | 39.01 | 19 | 29.07 | 9 | -9.94 |
S Rajesh is stats editor of ESPNcricinfo. Follow him on Twitter