A career of highs and lows
Harbhajan Singh has had his share of difficult moments in international cricket, but he has handled them all to become only the fourth spinner to reach 400 wickets in Tests
S Rajesh
08-Jul-2011
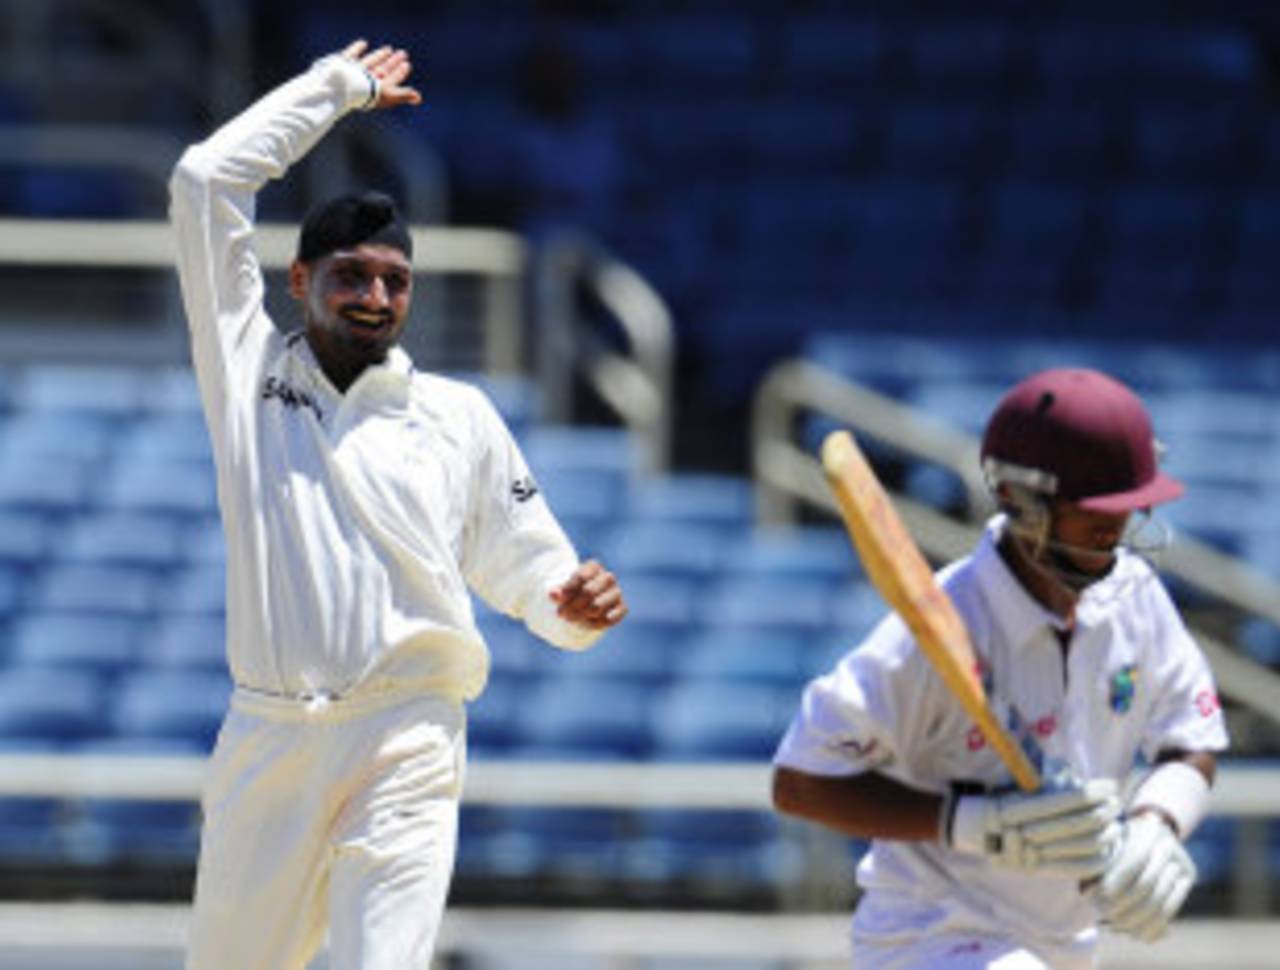
Harbhajan Singh is only the third Indian to get to 400 Test wickets • AFP
Only three spinners have achieved the landmark that Harbhajan Singh did on the second day of the Dominica Test, when Carlton Baugh missed a cut off an offspinner that turned sharply, and was bowled. That dismissal was his 400th in Test cricket, which puts him in an exclusive club which now has 11 members. Anil Kumble and Kapil Dev are the only Indians among them, while Muttiah Muralitharan, Shane Warne and Kumble are the three spinners in the club.
From the moment he took 32 wickets in that unforgettable three-Test series against Australia in 2001 - Harbhajan had only played eight matches before that series - he was earmarked for greatness, and while the journey thereafter hasn't always been smooth, there have been a fair number of highs, including six Man-of-the-Match awards and many other games when he has contributed significantly to wins.
His Test career is now already into its 14th year, and as the table below indicates, there have been ups and downs along the way. The series against Australia in 2001 kickstarted a period that brought him plenty of success, especially at home. In his first 50 Tests, he averaged less than 28 runs per wicket and won five of his six match awards. His strike rate was exceptional, and 17 out of his 25 five-fors, and four out of five ten-fors, came during this period.
Then followed a two-year slump, during which period each of his 37 wickets cost him more than 52 runs. It started with a wicketless series in Pakistan, which remains the only series when Harbhajan has failed to pick up a single wicket despite playing more than one Test. Even in the two home series he played during that period - against England and Pakistan - he averaged more than 40, while the tour to Australia in 2007-08 fetched eight wickets at 61.25.
That was a bleak period, but in the last three years, the numbers are looking better, with Harbhajan averaging less than 30 in six of the last 12 series (before the current West Indies tour). Even so, question-marks remain over his effectiveness, and over the influence of limited-overs cricket on his variations: in the first two Tests of the ongoing series in the West Indies, Harbhajan managed only five wickets against a fairly ordinary West Indies batting line-up.
| Period | Tests | Wickets | Average | Strike rate | 5WI/ 10WM |
| Till Dec 2005 | 50 | 219 | 27.87 | 60.9 | 17/ 4 |
| Jan 2006 to Feb 2008 | 13 | 37 | 52.27 | 98.5 | 3/ 0 |
| Mar 2008 onwards | 33 | 144 | 32.52 | 69.2 | 5/ 1 |
| Career | 96 | 400 | 31.80 | 67.4 | 25/ 5 |
The Indian pitches and the SG balls have always given Harbhajan more wicket-taking opportunities, so it's no surprise that his home average is about ten runs better than his overseas one. In the early part of his career, the difference between his home and away numbers were even higher - till the end of 2005 he averaged 23.99 at home and more than 37 overseas, while the difference in strike rate was 20 balls over wicket. During that period, only two of his 17 five-fors were in away Tests - in the 2002 series in the West Indies and in England.
In the last three years, though, the away record has improved significantly, even as the home numbers have fallen away a bit: in fact, his home and away averages during this period are almost identical. In the Galle Test in July 2008, Harbhajan returned match figures of 10 for 153, his maiden ten-wicket haul overseas. (The Man-of-the-Match award eluded him, though, because Virender Sehwag scored 201 and 50 in a Test in which most of the other batsmen struggled.) More recently, in the three-Test series in New Zealand and South Africa, Harbhajan was among the wickets in key games.
In fact, in the five overseas Tests that India have won during this period, Harbhajan has taken 28 wickets at 20.75, showing that he is a key element of India's bowling attacks overseas as well. In the previous nine overseas wins that he was a part of, Harbhajan only took 26 wickets at 31.42.
In contrast, his average in overseas defeats over the last three years is 73.50.
| Period | Tests | Wickets | Average | Strike rate | 5WI/ 10WM |
| Till Dec 2005 | 28 | 154 | 23.99 | 55.0 | 15/ 4 |
| Jan 2006 to Feb 2008 | 6 | 18 | 45.83 | 100.5 | 1/ 0 |
| Mar 2008 onwards | 18 | 86 | 32.74 | 70.4 | 2/ 0 |
| Career | 52 | 258 | 28.43 | 63.3 | 18/ 4 |
| Period | Tests | Wickets | Average | Strike rate | 5WI/ 10WM |
| Till Dec 2005 | 22 | 65 | 37.07 | 75.0 | 2/ 0 |
| Jan 2006 to Feb 2008 | 7 | 19 | 58.36 | 96.7 | 2/ 0 |
| Mar 2008 onwards | 15 | 58 | 32.18 | 67.5 | 3/ 1 |
| Career | 44 | 142 | 37.92 | 74.8 | 7/ 1 |
His stats against right and left-handers offers further evidence of how much his bowling has changed in the last decade. Between 2002 and 2005, Harbhajan was far more penetrative against right-handers - that was the period when his doosra was at its best, and the variations between his offspinners (which turned significantly) and the doosra were enough to trouble the best of right-handers. His average against left-handers was almost nine more than that against the right-hand counterparts.
Since March 2008, though, his average against the left-handers is better, with the average dipping below 30, even as his average against the right-handers has gone up significantly, to almost 35 runs per wicket.
| Wickets | Average | Strike rate | |
| v right-handers, overall | 215 | 31.84 | 63.48 |
| v left-handers, overall | 104 | 33.56 | 78.89 |
| v right-handers, between 2002 and 2005 | 98 | 24.54 | 52.49 |
| v left-handers, between 2002 and 2005 | 40 | 33.27 | 76.82 |
| v right-handers, since Mar 2008 | 88 | 34.89 | 68.57 |
| v left-handers, since Mar 2008 | 56 | 29.39 | 70.50 |
Through much of Harbhajan's career Kumble played a big role, so let's compare how his numbers look in matches when Kumble was around and when he wasn't. His overall stats are better without Kumble, but that's largely because of that outstanding series in 2001 against Australia. Remove that, and his bowling average in matches without Kumble goes up to almost 34, with only four five-fors in 39 Tests, which is an average of one every 9.75 Tests; when Kumble was around, the ratio was one in every 3.18 Tests.
| Tests | Wickets | Average | Strike rate | 5WI/ 10M | |
| With Kumble | 54 | 220 | 32.60 | 69.1 | 17/ 3 |
| Without Kumble | 42 | 180 | 30.83 | 65.3 | 8/ 2 |
| W/O Kumble excl 2001 Aus series | 39 | 148 | 33.81 | 72.2 | 4/ 0 |
Muralitharan had once commented that the one bowler who stood a chance to get somewhere close to his mark of 800 wickets was Harbhajan. That's probably a milestone too far, but Harbhajan only turned 31 a week ago, which suggests he has plenty of Test cricket left in him: going by historical data, most top spinners have continued to be among the wickets well into their 30s. Each of Muralitharan, Warne and Kumble took around 350 Test wickets after they turned 31, and more-or-less maintained or bettered their career bowling average. Even going by those numbers, Murali's mark of 800 is an extremely tall order, but Kumble's mark of 619 is surely within reach.
| Bowler | Tests | Wickets | Average | Strike rate | 5WI/ 10WM | Career ave |
| Muttiah Muralitharan | 55 | 363 | 21.76 | 49.2 | 31/ 11 | 22.72 |
| Shane Warne | 61 | 342 | 24.82 | 50.3 | 21/ 6 | 25.41 |
| Anil Kumble | 71 | 343 | 30.98 | 63.3 | 19/ 5 | 29.65 |
At the moment, Harbhajan is the only one among the 11 in the 400-club with an average of more than 30. However, it needs to be remembered that he hasn't finished his Test career, and has a chance to improve those figures over the next few years. And Harbhajan's numbers compare reasonably well with the best spinners that India have produced. His performances over the next few years - especially on the tougher tours of England and Australia - will determine if Harbhajan will go down in the record books as a very good spin bowler, or something beyond that.
| Bowler | Tests | Wickets | Average | Strike rate | 5WI/ 10WM |
| Muttiah Muralitharan | 133 | 800 | 22.72 | 55.0 | 67/ 22 |
| Shane Warne | 145 | 708 | 25.41 | 57.4 | 37/ 10 |
| Anil Kumble | 132 | 619 | 29.65 | 65.9 | 35/ 8 |
| Harbhajan Singh | 96 | 400 | 31.80 | 67.4 | 25/ 5 |
| Daniel Vettori | 105 | 345 | 33.98 | 77.8 | 19/ 3 |
| Lance Gibbs | 79 | 309 | 29.09 | 87.7 | 18/ 2 |
| Bowler | Tests | Wickets | Average | Strike rate | 5Wi/ 10WM |
| Anil Kumble | 132 | 619 | 29.65 | 65.9 | 35/ 8 |
| Harbhajan Singh | 96 | 400 | 31.80 | 67.4 | 25/ 5 |
| Bishan Bedi | 67 | 266 | 28.71 | 80.3 | 14/ 1 |
| BS Chandrasekhar | 58 | 242 | 29.74 | 65.9 | 16/ 2 |
| Erapalli Prasanna | 49 | 189 | 30.38 | 75.9 | 10/ 2 |
| Vinoo Mankad | 44 | 162 | 32.32 | 90.6 | 8/ 2 |
| S Venkataraghavan | 57 | 156 | 36.11 | 95.3 | 3/ 1 |
| Ravi Shastri | 80 | 151 | 40.96 | 104.3 | 2/ 0 |
| Subhash Gupte | 36 | 149 | 29.55 | 75.7 | 12/ 1 |
S Rajesh is stats editor of ESPNcricinfo.