More runs, longer careers, fewer breaks: how cricket has changed over the past 30 years
There have been seismic shifts in cricket but some aspects of the game haven't changed as much as we may have imagined
Dustin Silgardo
17-Apr-2023
Next stop 500: ODI totals have been inching ever higher since 1993 • Richard Heathcote/Getty Images
You don't need numbers to tell you that cricket over the past 30 years has grown multifold, become faster, more frenetic. Your intuition, if it has survived the whirlwind that was the advent of T20, the shock of the Big Three takeover, and the clear shift from cricket as a live spectator experience to a broadcast property, will tell you that batters score runs faster; Tests finish in results other than draws more often; India, England and Australia dominate the scheduling; and cricketers play significantly more matches. But to what degree has the game changed? A look at the data ESPNcricinfo has accrued over the past 30 years reveals that on some parameters, the game has not changed as much as we might believe, while on others, the changes are more dramatic than we imagined.
Run rates have risen, team totals have skyrocketed
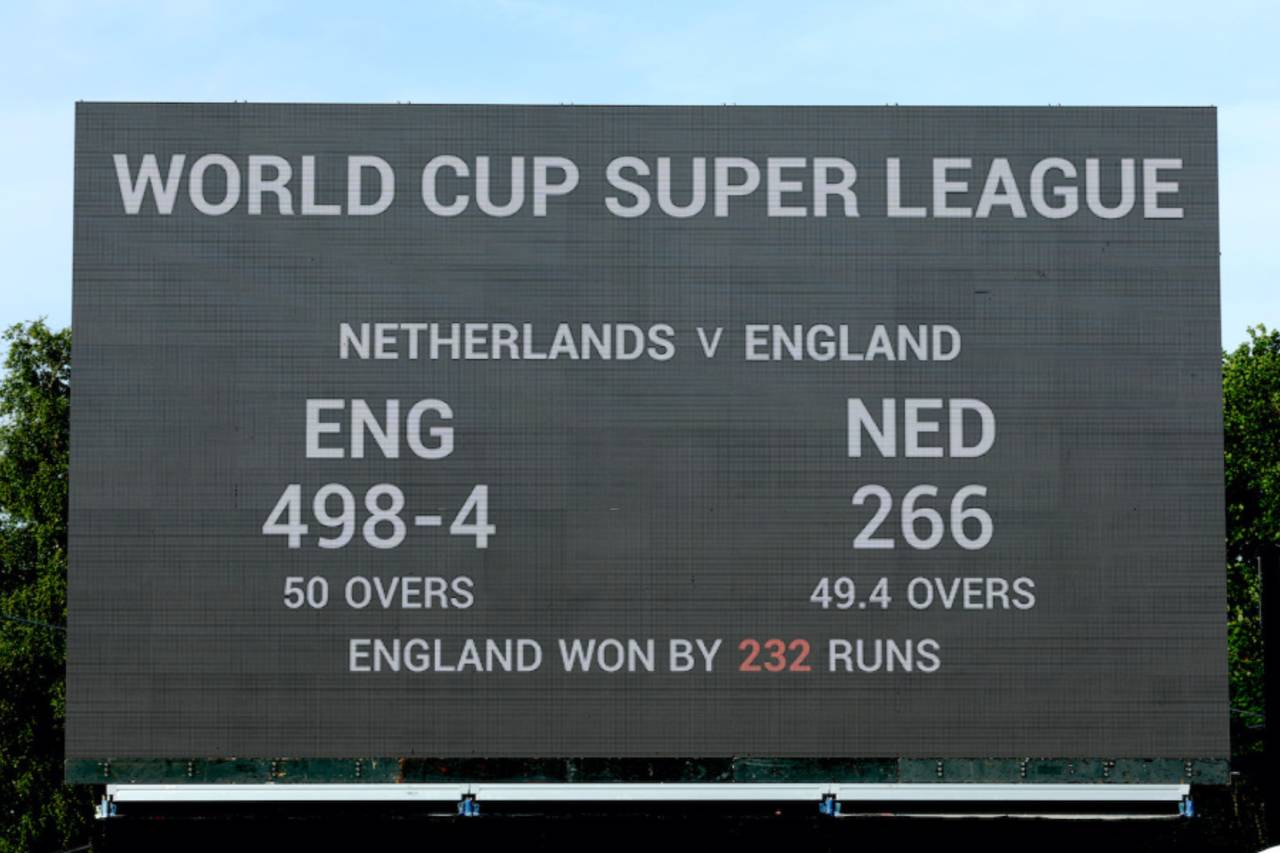
It is generally understood that the invention of T20 cricket has led to a significant increase in the speed of scoring in the other formats too. A look at the data for ODIs suggests that while run-scoring has become quicker in the T20 age, it is not by the degree one might have guessed. It is slightly surprising, for example, to see that the average run rate in ODIs in 2005 (5.10) is higher than that in 2021-22 (5.02). ODI run rates peaked in 2015, with runs coming at 5.50 an over. But the rise between 2007, the year of the first T20 World Cup, and 2015 - 9.12% - is actually less than the rise between 1993 and 2005 - 16.97%. It would seem that run rates in ODIs were already rising steadily through the '90s and 2000s and have kept rising, with some dips, since.While the rise in the mean run rate has not been startling, the extreme highs of the big totals have been. Back in 1993, a total of 400-plus in ODIs seemed unthinkable. But when the mark was breached in 2006, it was broken twice in one game, with South Africa famously scoring 438 in response to Australia's 434. Sixteen years on, England came close to crossing 500.
The critics of the T20 game have suggested that it has eroded batters' ability to concentrate for long periods, and made players keen on scoring quick runs rather than on batting time across formats. The data does show that batting averages have dipped since their peak in the mid- and late 2000s. Between 2018 and 2021, for four consecutive years the aggregate Test batting average was below 30. In 2018 that average was 26.28, the lowest in the last 30 years. While much of that can be put down to difficult pitches and strong bowling attacks, it is noticeable that the dips in averages are not necessarily accompanied by dips in strike rates. The overall batting strike rate in Tests has risen from the low 40s in the 1990s to the low 50s, and even in years such as 2019, when the batting average dropped to 29.34, the strike rate stayed well above 50.
The upside of faster scoring rates in Tests is that many more matches now produce finishes compared to the 1990s and 2000s. By the 2000s, the percentage of finishes had climbed into the 70s, and since the mid-2010s it has risen into the 80s. The years 2018 and 2019 produced record percentages of finishes, with New Zealand the only country to host more than one draw in the entire two-year stretch.
The volume of cricket has risen, but not a great deal for individual players
One palpable change in cricket over the last 30 years is just how much of it there is. Not only do we now have franchise tournaments in almost every cricket-playing country, the amount of international cricket has also shot up. Even if you take the 301 internationals between Tests nations in 2022 as a bit of an oddity - the Covid-19 pandemic led to a backlog of games - the 200-plus games that have been played in all but one year since 2006 are in stark contrast to figures of the early 1990s.The number of Test-playing nations has increased, of course, but even when you look at numbers for individual teams, there is more in the international calendar now than in the 1990s and 2000s. India, for example, played over 50 internationals each in each of 2017, 2018 and 2019; prior to 2005 they had just three years where they played 50-plus internationals. With three formats to play and the price of broadcast rights soaring, tours are compressed into a few days each, with limited days between games and even less time for tour matches.
So does that mean individual players actually play more internationals? With workload management and squad rotation now a staple of the cricket lexicon, players aren't necessarily playing more internationals than they once did. In fact, the last time a player participated in more than 50 internationals in a calendar year was back in 2014. The highest for the past 30 years is 53 - Rahul Dravid played that many internationals in 1999, Mohammad Yousuf hit the same number in 2000, and MS Dhoni in 2007.
Of course, players did not have franchise cricket in the 1990s and 2000s. In 2018, Rashid Khan played an astounding 83 top-level matches, the most anyone has managed in a calendar year since ESPNcricinfo was launched. In contrast, the most matches played by any cricketer in 1993 was 51, for Ian Healy. Healy might point out that 27 of the games he played in 1993 were four or five-day games, while all of the games Rashid played in 2022 were one-dayers, so the overall number of days of cricket Healy played was probably greater than for Rashid. Still, Rashid played in nine different countries compared to three for Healy. Ravi Bopara, whose 79 matches in 2010 are the third most for any cricketer in a calendar year since 1993, also has the most matches recorded in the ESPNcricinfo database: an astounding 898 games in all.
Cricketers now have longer careers - bowlers especially
Of the ten players with more than 150 Tests to their name, only Steve Waugh and Allan Border began their careers before 1993. The growing status of the Under-19 World Cup has meant players are being spotted younger, and modern sports science ensures they can play at the highest level till they are much older than in the past. As a result, the 10,000-Test-run club, which had just two members before 1993, now has 14.More remarkable is the length of bowlers' careers. When Fred Trueman took his 300th Test wicket, there was speculation the feat would never be matched. Trueman himself said someone whoever broke his record "will be bloody tired." In 2023, 300 wickets is considered a minor milestone, and even 400 wickets is now a mark breached by 17 bowlers.
Have the Big Three taken over?
When the cricket boards of India, England and Australia planned an overhaul of the ICC structure in 2014 that would give them a disproportionate share of revenue and power, cricket purists feared it would mean less cricket and falling standards in the other cricketing countries. While the Big Three plan was officially scrapped in 2017, India, England and Australia only play four- or five-Test series against each other, leaving many other captains complaining they don't get enough high-quality Test cricket. A look at the numbers shows that the Big Three played a significant percentage of their internationals against each other even before 2014, but that number has now inched closer to 30%.Dustin Silgardo is an assistant editor at ESPNcricinfo